Financial Statement Analysis Predicting Stock Returns
Financial statement analysis and the prediction of stock returns: a seemingly straightforward task, right? Wrong! It’s a thrilling rollercoaster ride through the world of balance sheets, income statements, and enough ratios to make your head spin. This isn’t your grandma’s accounting class; we’re diving into the murky depths of predicting the future, armed with nothing but numbers and a healthy dose of skepticism. Prepare for a wild ride!
We’ll explore the fascinating interplay between a company’s financial health, as revealed by its statements, and the often-unpredictable dance of the stock market. We’ll dissect key ratios, delve into advanced analytical techniques (because spreadsheets are fun!), and even confront the elephant in the room: the inherent uncertainty of it all. Think of it as a financial detective story, where the clues are hidden in the footnotes.
Introduction to Financial Statement Analysis and Stock Return Prediction

Predicting stock returns is like trying to catch a greased piglet – fun in theory, messy in practice. While no crystal ball guarantees riches, financial statement analysis provides a surprisingly insightful, albeit imperfect, glimpse into a company’s health and potential future performance. Understanding a company’s financials can offer clues about its profitability, solvency, and efficiency, all of which can influence investor sentiment and, consequently, stock prices. However, let’s be clear: it’s not a foolproof system. Think of it as a highly sophisticated detective’s toolkit, not a magic wand.
Financial statement analysis alone cannot accurately predict stock returns. Market sentiment, macroeconomic factors, unforeseen events (like a rogue pandemic or a celebrity endorsement gone wrong), and even plain old market irrationality all play a significant role. Using financial statements is like having a detailed map of a city; it helps you navigate, but it won’t predict every traffic jam or detour. Other factors, such as industry trends, competitive landscape, and management quality, must also be considered for a more complete picture. In short, while financial statement analysis is a crucial tool, it’s just one piece of a much larger, and often unpredictable, puzzle.
Types of Financial Statements Used in Stock Return Prediction
Financial statement analysis relies heavily on three core documents: the balance sheet, the income statement, and the cash flow statement. The balance sheet provides a snapshot of a company’s assets, liabilities, and equity at a specific point in time – think of it as a company’s financial selfie. The income statement, on the other hand, shows a company’s revenues, expenses, and profits over a period of time, offering a view of its financial performance like a movie trailer. Finally, the cash flow statement tracks the movement of cash both into and out of the company, providing a crucial insight into its liquidity and operational efficiency. Imagine it as a detailed account of the company’s financial transactions, showing the ebb and flow of cash. Together, these three statements paint a comprehensive, though not entirely predictable, portrait of a company’s financial condition.
Key Financial Ratios
Understanding these statements is only half the battle; the real magic happens when you start calculating financial ratios. These ratios provide a standardized way to compare a company’s performance over time or against its competitors. Below is a summary of some commonly used ratios. Remember, context is key! A high ratio isn’t always good, and a low ratio isn’t always bad. The interpretation depends heavily on the specific industry and the company’s overall business model.
| Ratio | Formula | Interpretation | Example |
|---|---|---|---|
| Current Ratio | Current Assets / Current Liabilities | Measures a company’s ability to pay its short-term obligations. A higher ratio generally indicates better liquidity. | A current ratio of 2 suggests a company has twice the current assets to cover its current liabilities. |
| Debt-to-Equity Ratio | Total Debt / Total Equity | Indicates the proportion of a company’s financing that comes from debt versus equity. A higher ratio suggests higher financial risk. | A debt-to-equity ratio of 0.5 means a company has half as much debt as equity. |
| Return on Equity (ROE) | Net Income / Total Equity | Measures how efficiently a company uses its equity to generate profits. A higher ROE is generally desirable. | An ROE of 15% means the company generates 15 cents of profit for every dollar of equity. |
| Price-to-Earnings Ratio (P/E) | Market Price per Share / Earnings per Share | Shows how much investors are willing to pay for each dollar of a company’s earnings. A higher P/E ratio may suggest higher growth expectations. | A P/E ratio of 20 means investors are willing to pay $20 for every $1 of earnings. |
Key Financial Ratios and Their Predictive Power
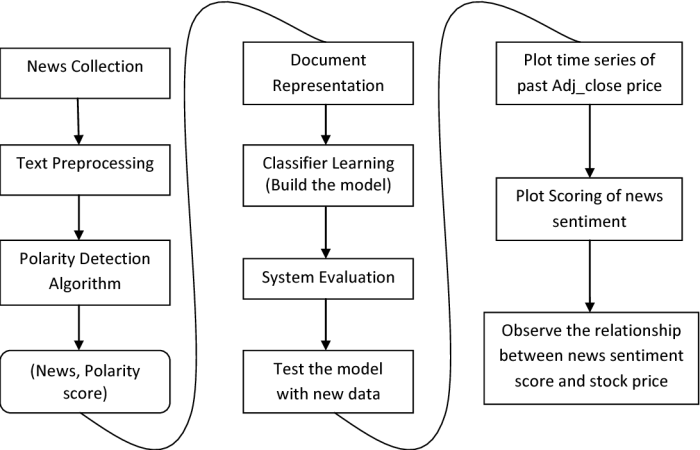
Financial statement analysis isn’t just for accountants who enjoy the thrill of meticulously balanced ledgers; it’s a crucial tool for predicting stock returns. Think of it as a financial crystal ball, albeit one that requires a bit of number-crunching and a healthy dose of skepticism. By carefully examining key ratios, we can gain valuable insights into a company’s health, profitability, and future prospects – information that can significantly influence investment decisions, potentially turning your portfolio from a sleepy tortoise into a sprinting hare.
The predictive power of financial ratios isn’t a guarantee of future riches (sadly, if it were, we’d all be billionaires), but it significantly enhances our ability to make informed investment choices. These ratios, when used intelligently, can help us identify companies poised for growth and avoid those teetering on the brink of disaster. Remember, even the best crystal ball needs a skilled interpreter.
Profitability Ratios and Stock Return Forecasts
Profitability ratios, such as Return on Equity (ROE), Return on Assets (ROA), and gross margin, provide a window into a company’s ability to generate earnings from its resources. A consistently high ROE, for instance, suggests efficient use of shareholder equity and strong profitability, potentially signaling future stock price appreciation. Similarly, a healthy ROA indicates efficient asset utilization, while a robust gross margin highlights the company’s pricing power and cost control. However, relying solely on profitability ratios can be misleading. A company might show impressive profitability in the short-term due to one-off events, while underlying weaknesses might remain hidden. Therefore, a holistic approach is necessary, combining profitability analysis with other ratio analyses. For example, a company like Apple, historically known for high profitability ratios, reflects this in its stock performance, although external factors and market sentiment also play a role.
Liquidity and Solvency Ratios: A Tale of Two Sides
Liquidity ratios, such as the current ratio and quick ratio, assess a company’s ability to meet its short-term obligations. A high current ratio suggests ample liquidity, reducing the risk of default. Solvency ratios, such as the debt-to-equity ratio, gauge a company’s ability to meet its long-term obligations. A high debt-to-equity ratio indicates a heavily leveraged company, which, while potentially boosting returns in good times, can become extremely risky during economic downturns. While liquidity ratios are crucial for assessing short-term stability, solvency ratios provide a longer-term perspective on financial risk. A company with excellent liquidity might still be burdened by excessive debt, limiting its future growth potential. Consider the case of a rapidly growing tech startup; high debt might be acceptable if the growth trajectory justifies the risk, but a similar debt level in a mature, slow-growth industry would likely be a major red flag.
Efficiency Ratios and Operational Prowess
Efficiency ratios, such as inventory turnover and asset turnover, reveal how effectively a company manages its resources. High inventory turnover suggests efficient inventory management, minimizing storage costs and maximizing sales. Similarly, a high asset turnover ratio indicates efficient use of assets to generate sales. These ratios are vital indicators of operational efficiency and can significantly impact stock returns. A company that excels in efficiency typically enjoys higher profitability and lower costs, enhancing its competitive advantage and attracting investors. For instance, a company like Walmart, renowned for its efficient supply chain and inventory management, demonstrates the positive correlation between efficiency ratios and long-term success.
Hypothetical Investment Scenario: A Ratio-Based Decision
Let’s imagine two companies, “Speedy Growth Inc.” and “Steady Eddie Corp.” Speedy Growth boasts high ROE and ROA but also a high debt-to-equity ratio and relatively low liquidity ratios. Steady Eddie, on the other hand, exhibits moderate profitability, strong liquidity, and low debt. An investor with a high-risk tolerance might favor Speedy Growth, anticipating significant returns despite the higher risk. A more conservative investor might prefer Steady Eddie, prioritizing stability and lower risk over potentially higher returns. The optimal choice depends entirely on the investor’s risk profile and investment goals. This illustrates how different combinations of ratios can lead to vastly different investment decisions.
Advanced Analytical Techniques
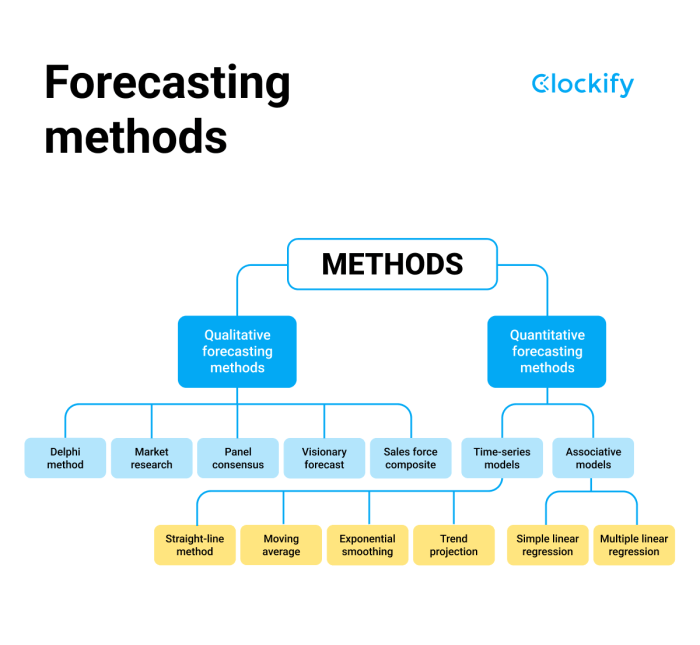
Predicting stock returns is like trying to predict the weather in Scotland – you can make an educated guess, but be prepared for surprises! Fortunately, we have more than just crystal balls at our disposal. Advanced analytical techniques, when combined with the fundamental financial data we’ve already explored, offer a more sophisticated approach to forecasting stock market movements. Let’s delve into the fascinating world of number crunching for financial gain (or at least, a better understanding of the market).
These techniques move beyond simple ratio analysis, employing statistical models to uncover hidden relationships and predict future trends. The power lies in combining rigorous quantitative methods with the qualitative insights gleaned from understanding a company’s financial health. It’s a marriage of art and science, a beautiful ballet of balance sheets and regressions.
Fundamental Analysis and Financial Statement Data
Fundamental analysis, at its core, involves assessing a company’s intrinsic value based on its financial statements. This involves a deep dive into the balance sheet, income statement, and cash flow statement, extracting key metrics and ratios to gauge profitability, solvency, and liquidity. By comparing these metrics to industry benchmarks and historical trends, analysts can form an opinion on whether a stock is undervalued or overvalued. For example, a consistently high return on equity (ROE) might suggest a company’s strong management and potential for future growth, influencing the prediction of higher future stock returns. Conversely, a declining current ratio could signal liquidity problems and potentially lower returns. The key is to identify those ratios that have statistically significant correlations with future stock performance.
Regression Analysis and Stock Returns
Regression analysis provides a powerful framework for modeling the relationship between financial ratios and stock returns. This statistical technique allows us to quantify the impact of various financial variables on stock returns. A simple linear regression model might look like this:
Returnt = β0 + β1ROEt-1 + β2Debt-to-Equityt-1 + εt
where Returnt represents the stock return in period t, ROEt-1 and Debt-to-Equityt-1 are the return on equity and debt-to-equity ratio in the previous period, β0 is the intercept, β1 and β2 are the regression coefficients representing the impact of ROE and Debt-to-Equity on stock returns, and εt is the error term. By estimating these coefficients, we can determine the strength and direction of the relationship between financial ratios and future stock returns. More complex models might incorporate multiple variables and account for non-linear relationships. For instance, a study might find that a high ROE is positively correlated with stock returns up to a certain point, after which the relationship weakens or even becomes negative (perhaps due to diminishing returns or increased risk).
Time Series Analysis for Stock Price Forecasting
Time series analysis uses historical stock price data to identify patterns and trends, allowing for the prediction of future prices. Techniques like ARIMA (Autoregressive Integrated Moving Average) models can capture the autocorrelation inherent in stock price data. These models assume that future prices are influenced by past prices and other relevant factors. For example, an ARIMA model might be used to forecast the future price of a stock based on its past price movements, taking into account seasonal effects or other recurring patterns. However, it’s crucial to remember that these models are based on historical data and may not accurately reflect future market conditions, especially in periods of significant market volatility. The effectiveness of time series analysis hinges on the assumption that past patterns will persist in the future – a brave assumption in the often-chaotic world of stock markets.
Comparison of Statistical Methods, Financial statement analysis and the prediction of stock returns
Different statistical methods possess unique strengths and weaknesses when applied to stock return prediction. While regression analysis excels at identifying relationships between variables, it may struggle with non-linear relationships or time-varying parameters. Time series analysis is adept at capturing temporal dependencies, but it may overfit the data or be sensitive to outliers. Other methods, such as machine learning algorithms (e.g., neural networks, support vector machines), can handle complex relationships and large datasets but require significant computational power and careful tuning to avoid overfitting. The choice of method often depends on the specific dataset, research question, and the analyst’s expertise. The “best” method is rarely universally applicable; rather, a combination of approaches often yields the most robust and reliable predictions. Think of it like having a toolbox filled with different instruments – each tool serves a specific purpose, and a skilled craftsman knows when to use each one effectively.
Qualitative Factors and Their Influence

Predicting stock returns is a bit like predicting the weather – you can use fancy algorithms and historical data, but sometimes a rogue gust of wind (or a rogue CEO) can throw everything off. While financial statements provide a crucial quantitative backbone, ignoring the qualitative factors is like trying to navigate by the stars while wearing a blindfold. These non-financial aspects significantly impact a company’s prospects and, consequently, its stock price.
Ignoring the qualitative landscape is akin to investing based solely on a company’s meticulously-maintained accounting books, while ignoring the fact that their factory is built on a fault line. A robust prediction model needs to incorporate both the hard numbers and the softer, more nuanced aspects of a company’s environment.
Management Quality and Corporate Governance
Effective leadership is the engine driving a company’s success. A strong management team with a proven track record of innovation and strategic decision-making inspires investor confidence. Conversely, a history of accounting scandals, questionable ethical practices, or a revolving door of CEOs can send shivers down the spines of even the most seasoned investors. For example, the spectacular rise and fall of Enron serves as a stark reminder of how poor management and a lack of corporate governance can lead to catastrophic financial consequences, wiping out shareholder value in the blink of an eye. Conversely, a company with transparent and ethical practices, like Costco, often enjoys a premium valuation reflecting investor trust.
Industry Trends and Competitive Landscape
The competitive landscape plays a crucial role in determining a company’s future prospects. A company operating in a rapidly growing industry with strong barriers to entry has a significantly higher chance of success than one facing intense competition and declining demand. Consider the disruptive impact of smartphones on the traditional camera industry. Companies that failed to adapt were left behind, while those that embraced the change thrived. Analyzing industry trends, including technological advancements, regulatory changes, and shifts in consumer preferences, is vital for accurately predicting stock returns.
Economic Conditions and Macroeconomic Factors
The broader economic climate significantly influences a company’s performance. A recession can negatively impact even the most well-managed companies, while a period of strong economic growth can benefit almost everyone. Interest rate hikes, inflation, and geopolitical events all play a role. For instance, the 2008 financial crisis decimated even seemingly robust companies, highlighting the vulnerability of even the strongest balance sheets to unforeseen macroeconomic shocks. Conversely, companies that are well-positioned to weather economic downturns, such as those in defensive sectors like consumer staples, often outperform during such periods.
Incorporating Qualitative Information into Predictive Models
Quantifying qualitative factors is a Herculean task, akin to trying to weigh a cloud. However, various techniques can be employed to incorporate qualitative information. One approach is to use sentiment analysis of news articles, social media posts, and analyst reports to gauge market sentiment towards a company. Another approach is to assign numerical scores to qualitative factors based on expert opinions or industry benchmarks. For example, a management team’s track record could be scored on a scale of 1 to 5, with 5 representing exceptional performance. These scores can then be incorporated into a regression model or other quantitative frameworks, although the inherent subjectivity must be acknowledged and addressed.
Examples of Qualitative Factors Reinforcing or Contradicting Financial Analysis
A company might have excellent financial ratios, but if its industry is facing obsolescence, its future prospects could be bleak. Conversely, a company with seemingly mediocre financial statements might be poised for significant growth due to its innovative products or strong management team. The success of Tesla, initially showing relatively weak financial performance compared to established automakers, exemplifies this. Its strong management, innovative technology, and growing market share eventually led to a significant increase in its stock price, defying initial financial statement analysis predictions.
Challenges of Quantifying Qualitative Factors
The inherent subjectivity of qualitative factors makes their quantification challenging. Different analysts may assign different scores to the same qualitative factor, leading to inconsistencies in predictions. Furthermore, the impact of qualitative factors can be difficult to isolate from other factors, making it challenging to establish clear cause-and-effect relationships. It’s a bit like trying to disentangle a bowl of spaghetti – you can see the individual strands, but it’s hard to say exactly where one begins and another ends. The challenge lies in developing robust and reliable methods for incorporating these essential yet elusive factors into a comprehensive prediction model.
Risk and Uncertainty in Prediction
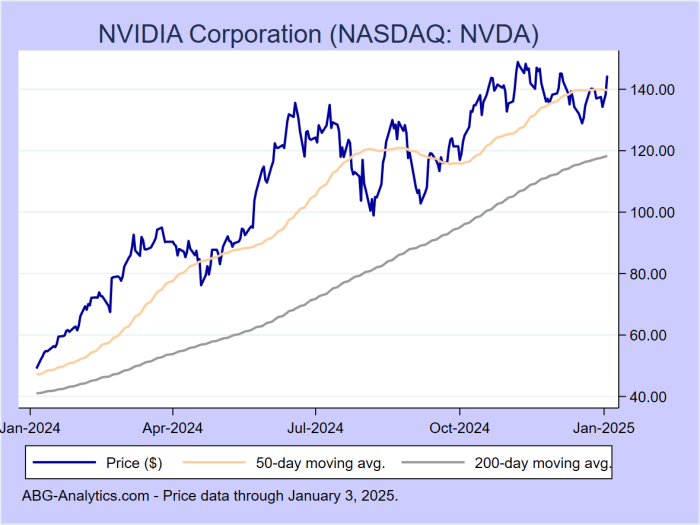
Predicting stock returns, even with the most sophisticated financial statement analysis, is akin to predicting the weather in a hurricane – possible, but with a hefty margin of error. The inherent volatility of the market, coupled with the unpredictable nature of human behavior and global events, makes precise forecasting a fool’s errand. While analysis provides valuable insights, it’s crucial to acknowledge the significant limitations.
Predicting stock returns based on financial statement analysis is a probabilistic exercise, not a deterministic one. Even the most meticulously crafted models are subject to unforeseen circumstances and inherent uncertainties. The accuracy of these predictions is heavily influenced by the efficiency of the market itself, as well as the presence of noise in the data.
Market Efficiency and Prediction Accuracy
The efficient market hypothesis (EMH) suggests that all available information is already reflected in current stock prices. If this is true, then predicting future returns based solely on publicly available financial statements becomes incredibly difficult, as any potential profit opportunity would be instantly arbitraged away. However, the degree of market efficiency is debatable; some argue that certain inefficiencies exist, allowing for skilled investors to identify undervalued or overvalued stocks. The presence of these inefficiencies, however small, is the very foundation upon which many prediction models are built. In reality, markets fluctuate between periods of high and low efficiency, making consistent prediction even more challenging.
Examples of Unexpected Events Impacting Stock Returns
The 2008 financial crisis serves as a stark reminder of how unpredictable events can completely derail even the most carefully constructed forecasts. The unexpected collapse of Lehman Brothers triggered a global panic, sending shockwaves through the financial system and causing significant losses across the board. Similarly, the COVID-19 pandemic in 2020 led to unprecedented market volatility, with rapid and significant shifts in stock prices as investors grappled with the uncertainty of the situation. Regulatory changes, such as unexpected shifts in tax laws or environmental regulations, can also dramatically alter the outlook for specific companies and sectors, often leading to unexpected shifts in stock valuation. Think of the recent surge in interest rates – a clear example of an unexpected macro-economic shift affecting predicted returns.
Types of Risk and Their Impact on Prediction Accuracy
The following table illustrates various types of risk impacting the accuracy of stock return predictions.
| Type of Risk | Description | Impact on Prediction Accuracy | Example |
|---|---|---|---|
| Systematic Risk (Market Risk) | Risk inherent to the overall market, irrespective of individual stock performance. | Reduces accuracy; broad market movements can overshadow individual company performance. | A global recession impacting all stocks regardless of financial health. |
| Unsystematic Risk (Specific Risk) | Risk specific to a particular company or industry. | Reduces accuracy; company-specific events can significantly alter predictions. | A product recall impacting a single company’s stock price. |
| Financial Risk | Risk associated with a company’s financial leverage and ability to meet its debt obligations. | Reduces accuracy; high debt levels can amplify losses during downturns. | A company defaulting on its debt, causing a sharp drop in stock price. |
| Operational Risk | Risk related to a company’s internal processes and operations. | Reduces accuracy; operational inefficiencies or disruptions can negatively impact performance. | A major cyberattack disrupting a company’s operations. |
Case Studies and Examples: Financial Statement Analysis And The Prediction Of Stock Returns
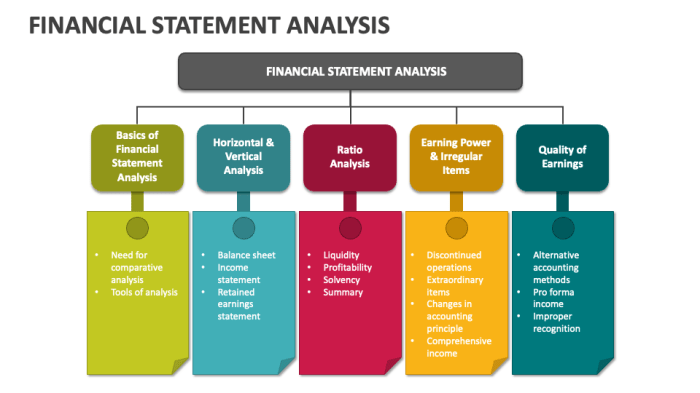
Financial statement analysis, while a fascinating dance of numbers, truly shines when applied to real-world scenarios. Let’s ditch the theoretical and dive headfirst into some juicy case studies, examining how these techniques have been used (and sometimes misused!) to predict stock returns. Buckle up, it’s going to be a wild ride.
The following case studies illustrate the application of financial statement analysis and prediction techniques, showcasing both successful and unsuccessful predictions. We’ll dissect the methods, the results, and the invaluable lessons learned along the way. Remember, even the most seasoned analysts occasionally stumble – it’s part of the thrilling, albeit occasionally humbling, process.
Case Study 1: The Rise and (Near) Fall of Company X
Company X, a tech darling of the early 2010s, experienced meteoric growth. Analysts, using a combination of discounted cash flow (DCF) models and ratio analysis (specifically focusing on high revenue growth and low debt-to-equity ratios), predicted continued high returns. Their analysis highlighted strong profitability metrics, particularly a high return on equity (ROE) and impressive profit margins. However, they underestimated the impact of increased competition and overexpansion, leading to a significant stock price correction in later years. The lesson? Even seemingly bulletproof ratios can be misleading without a thorough qualitative assessment of the broader market and competitive landscape. While the initial predictions based on strong financial statements were accurate in the short term, a lack of consideration for external factors led to a flawed long-term projection.
Case Study 2: The Steady Hand of Company Y
In stark contrast to Company X, Company Y, a well-established consumer goods company, demonstrated consistent and predictable growth over a longer period. Analysts, employing a more conservative approach using trend analysis of key financial ratios like the current ratio and inventory turnover, accurately predicted moderate but stable returns. The company’s focus on consistent profitability, efficient inventory management, and a stable debt structure allowed for more accurate predictions. This case highlights the importance of considering the company’s overall business model and its stability when forecasting returns. The predictability of Company Y’s financial performance allowed for more reliable forecasting compared to the volatile nature of Company X.
Comparative Analysis of Case Studies
| Company | Methodology | Key Ratios Used | Prediction Accuracy |
|---|---|---|---|
| Company X | DCF, Ratio Analysis (ROE, Profit Margins) | High ROE, High Profit Margins, Low Debt-to-Equity | Initially Accurate (Short-Term), Inaccurate (Long-Term) |
| Company Y | Trend Analysis | Current Ratio, Inventory Turnover | Accurate (Long-Term) |
Closing Notes
So, can we accurately predict stock returns using financial statement analysis? The short answer is: it’s complicated. While financial statements offer invaluable insights into a company’s performance, they are only one piece of a much larger puzzle. Market sentiment, unforeseen events, and even the whims of social media can throw a wrench into even the most meticulously crafted prediction. However, by understanding the limitations and employing a diverse range of analytical tools, we can significantly improve our odds of making informed investment decisions. Now go forth and conquer (the stock market, hopefully!).
FAQ Explained
What are some common pitfalls to avoid when using financial statement analysis for stock prediction?
Overreliance on historical data, neglecting qualitative factors, and failing to account for market sentiment are common pitfalls. Remember, the past is not always prologue!
How can I improve the accuracy of my stock return predictions?
Diversify your analytical approach, incorporating both quantitative and qualitative factors, and regularly review and adjust your models based on new information. Essentially, be flexible and don’t get married to any single prediction.
Are there any free resources available for learning more about financial statement analysis?
Yes! Many reputable online resources offer free courses, tutorials, and articles on financial statement analysis. A quick Google search will reveal a treasure trove of information (but always verify the credibility of the source!).


